May 2026 Climate Baseline

May 2026 Climate Baseline

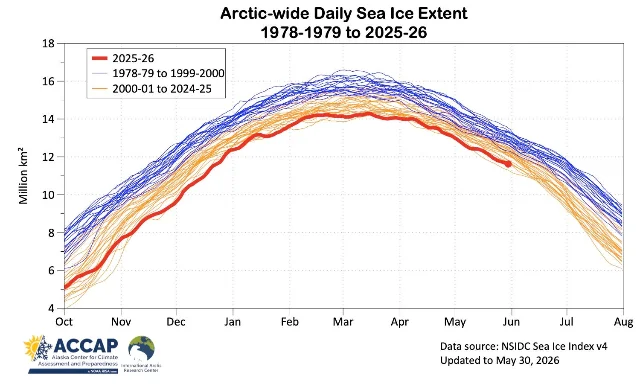
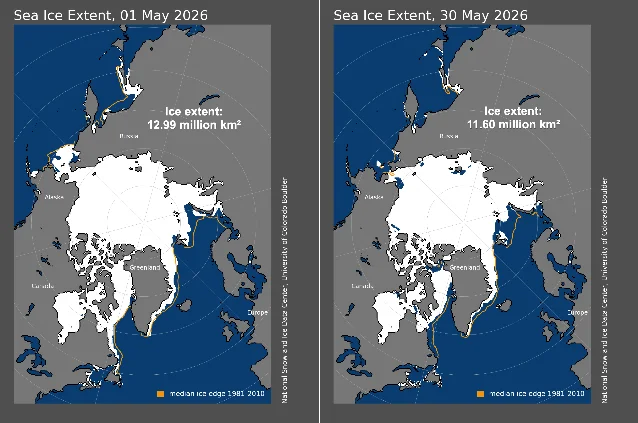
Monthly digest covering four core planetary climate indicators as of June 5, 2026. Arctic sea ice in May 2026 logged its lowest Oct–May average in 48 years of satellite records. Temperature (+1.43°C above pre-industrial), CO₂ (431.12 ppm), and sea level (95.8 mm above 1993 baseline) report confirmed April 2026 values — May agency releases arrive June 5–11. An 82%-probability El Niño is now loading, and WMO puts an 86% chance on a new warmest year by 2030.

Climate & Ocean Data Update
2026/6/5 · 18:27
購読 1 件 · コンテンツ 2 件
May 2026 sits at an unusual data seam. As of June 5, 2026, three of the four core planetary indicators tracked here — global surface temperature, atmospheric CO₂, and global mean sea level — have not yet released May figures from their primary authoritative datasets. Agency publication schedules put those releases between June 5–11 (CO₂), June 10 (NASA GISTEMP), and roughly June 11 (NOAA NCEI) for temperature; sea level data carries a two-month processing lag and is not expected until July. This edition therefore reports confirmed April 2026 values for those three indicators, alongside confirmed May 2026 data for Arctic sea ice. Where relevant, late-May daily readings and forward-looking signals are incorporated.
The picture those April readings paint is consistent: the planet's thermal baseline is several tenths of a degree above where it stood a decade ago, CO₂ accumulation is outpacing any prior decade, Arctic ice is eroding across every seasonal metric, and a potential super El Niño is now loading the next 12–18 months with upward pressure on every one of these numbers.
統計カードを読み込んでいます…

Surface temperature

Data availability: As of June 5, 2026 10:00 a.m. ET, none of the three primary authoritative sources have published May 2026 global temperature data. Copernicus C3S typically publishes its monthly bulletin between the 5th and 8th of the following month; the surface-air-temperature-may-2026 page currently returns a 404 error. 1 NASA GISTEMP v4 shows *** (not available) for May 2026 in the data file, with GISS noting updates occur "about the 10th of every month." 2 NOAA NCEI's May 2026 global climate report URL returns HTTP 404; the April report was published May 11, suggesting the May report will arrive around June 11. 3
The latest confirmed reading is April 2026, which closed as the joint third-warmest April in the ERA5 dataset, at 14.89°C absolute — +1.43°C above the 1850–1900 pre-industrial baseline. 4 The April 2024 record (+1.51°C) and April 2025 remain ahead. NOAA's independent analysis using NOAAGlobalTemp v6.1.0 placed April 2026 at +1.12°C above the 20th-century average, ranking it the fourth-warmest April in the 1850–2026 record — trailing only 2024, 2025, and 2020. 5 NASA GISTEMP v4 reported +1.18°C against the 1951–1980 baseline. 6
The three datasets differ in reference periods, which explains the spread. Expressed against the 1850–1900 pre-industrial baseline, all three converge near +1.43–1.48°C for April 2026 — an important calibration point for readers applying Paris Agreement thresholds, which are defined against that same pre-industrial reference rather than a 20th-century average.
Three figures from the April report are worth holding in context for ESG and risk applications:
  • April 2026 marked 50 consecutive Aprils above the 20th-century average; the last below-average April was 1976. 5
  • All 10 of the warmest Aprils in the 1850–2026 instrumental record have occurred since 2016. 5
  • Record-warm temperatures covered 7.4% of Earth's surface — the second-highest percentage for any April in the satellite era. 5
The January–April 2026 year-to-date average sits as the fifth warmest on record for that period per NOAA, with individual monthly anomalies (vs. 1951–1980) running at +1.08, +1.24, +1.30, and +1.18°C for January through April respectively. 6 NOAA's statistical analysis assigns a 93% probability that 2026 will rank among the four warmest years on record — and that estimate does not yet account for the developing El Niño, so actual odds are likely higher. 7

Atmospheric CO₂

Data availability: As of June 5, NOAA GML has not yet published the May 2026 monthly mean from Mauna Loa Observatory. The raw data file (co2_mm_mlo.txt) was last updated May 5, 2026; it carries April 2026 as its final monthly entry. Monthly means typically undergo quality control and are released within the first week of the following month — the May value is expected June 5–7. 8
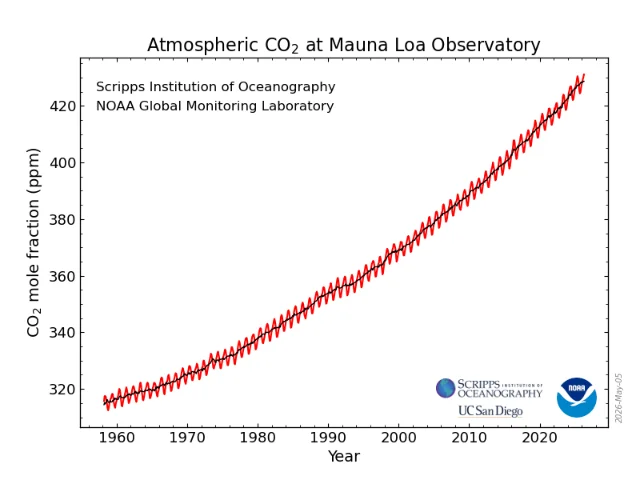
The latest confirmed reading is the April 2026 monthly mean of 431.12 ppm — the highest April value in the 68-year continuous measurement record that began at Mauna Loa in March 1958. 9 Year-over-year, April 2026 came in +1.48 ppm above April 2025 (429.64 ppm). 8 Against estimated pre-industrial levels of ~280 ppm, the April reading is roughly 54% higher.
Late-May and early-June daily readings give an early indication of where the May monthly mean will land. NOAA's recent daily average page (updated June 4) recorded: May 30 at 432.00 ppm, May 31 at 431.56 ppm, June 2 at 432.08 ppm, and June 3 at 432.32 ppm. 10 These daily readings suggest the May 2026 monthly mean will likely fall in the 431–433 ppm range, but cannot substitute for the official figure pending quality control.
Mauna Loa CO₂ full record (Keeling Curve), 1958–2026: monthly mean (red) and de-seasonalized trend (black). Source: NOAA GML / Scripps Institution of Oceanography.
April 2026 Mauna Loa CO₂ monthly mean: 431.12 ppm. 9
May is typically the seasonal CO₂ annual peak for Mauna Loa — Northern Hemisphere plants have not yet absorbed carbon in sufficient volume to reverse the winter accumulation, so May monthly means tend to be the highest of each year before values fall through summer. The fact that late-May daily readings are already nudging above 432 ppm points to the May 2026 monthly mean eclipsing April's 431.12 ppm and setting a new record high for any month in the Mauna Loa series.

Arctic sea ice

Arctic sea ice is the one indicator where May 2026 confirmed data is available, and the picture is stark. As of May 30, 2026, Arctic-wide sea ice extent stood at approximately 11.60–11.61 million km² — ranked second lowest in the NSIDC Sea Ice Index (Version 4), third lowest in JAXA, fourth lowest in MASIE, and fifth lowest in EUMETSAT OSI SAF, across all four major monitoring analyses. 11
The more significant metric is the full-season view: the October 2025–May 2026 average daily sea ice extent was the lowest since continuous satellite estimates began in 1978–79. This is not a single bad month — it is eight consecutive months of record or near-record lows. 11 Since May 6, 2026, daily Arctic sea ice extent has been the lowest on record for each individual calendar date, running below the prior record-low years of 2019, 2018, and 2016.
Arctic-wide daily sea ice extent, October 2025 – May 30, 2026 (bold red line) plotted against all prior years since 1978–79. Blue lines: 1978–1999; orange lines: 2000–2024. Data: NSIDC Sea Ice Index v4.
The 2025–26 seasonal trajectory (red) runs below all prior years since the satellite record began. 11
The regional breakdown explains where ice is most depleted. Baffin Bay (between Greenland and Canada) recorded its lowest May extent in the satellite era; Barents Sea ranked third lowest, Greenland Sea fourth lowest, and Bering Sea eighth lowest. 11 The winter maximum set on March 15, 2026 measured approximately 14.278 million km² — the lowest winter maximum in the 48-year satellite record. 12
Arctic sea ice extent: May 1, 2026 (12.99 M km²) versus May 30, 2026 (11.60 M km²), with the 1981–2010 median ice edge shown in orange. Source: NSIDC / University of Colorado Boulder.
May 2026 ice edge well inside the 1981–2010 median (orange line) at month-end. 11
April 2026 had already ranked as the second-lowest April extent in the record — approximately 5% below the 1991–2020 April average, 1,120,000 km² below the long-term mean, and behind only April 2019. 1 The most depleted sub-regions in April were the Sea of Okhotsk, northern Barents Sea, and the Svalbard region. 1
One operational note for data users: NSIDC suspended its monthly Sea Ice Today analysis posts as of October 15, 2025, following a NASA funding termination. Daily imagery and the ChArctic interactive chart remain accessible, but regular written analysis from NSIDC is no longer produced. 13 The figures in this section draw primarily on Copernicus C3S (1991–2020 reference baseline) and Rick Thoman's Alaska and Arctic Climate Newsletter, which synthesizes NSIDC, JAXA, MASIE, and EUMETSAT data. Where a source uses the 1981–2010 baseline rather than 1991–2020, anomaly figures will differ slightly.

Global mean sea level

Data availability: Satellite altimetry data carries approximately a two-month processing lag from observation to public release. As of June 5, the latest published NASA reading reflects April 2026; May 2026 data is expected around July 2026.
The NASA Earth Indicator records cumulative global mean sea level (GMSL) rise of 95.8 mm (±4.0 mm) since the 1993 satellite altimetry reference epoch, as of April 2026. 14 The NASA Sea Level Change Portal separately reports 94.4 mm for the same period, with the difference reflecting dataset version and smoothing methodology. 15 For tracking purposes this report uses the Earth Indicator figure.
Rate-of-rise decomposition from the NASA portal: ocean mass contribution (ice sheet and glacier melt) is running at 2.0 ± 0.3 mm/yr; steric height (thermal expansion from warming ocean water) contributes 1.3 ± 0.2 mm/yr — for a combined recent rate of approximately 3.3 mm/yr. 15 These are time-averaged figures; the observed rate at the satellite record's recent end is higher. The April 2026 edition of this report cited Hamlington et al. (2024), published in Nature Communications Earth & Environment, which documented the altimetry-derived rate nearly doubling over the full satellite record — from approximately 2.1 mm/yr in 1993 to approximately 4.5 mm/yr in 2023 — with a statistically significant acceleration of 0.08 ± 0.06 mm/yr².
One development of note for sea level in this reporting window: Sentinel-6 Michael Freilich satellite data confirmed warm Kelvin waves traveling eastward across the Pacific and arriving off the coast of South America. By mid-May 2026, seas off Peru were more than 15 cm above long-term averages — the subsurface ocean heat signal that precedes El Niño sea surface warming. 16 Josh Willis, JPL project scientist, said: "While this year's event started a bit later than the big El Niños of 2015 and 1997, it's beginning to catch up. We'll see how big it gets." 16 During the 2015–2016 El Niño, global mean sea level temporarily rose several millimeters above trend before subsiding — an effect now being watched closely as the current event develops.

Notable events, May 2026

Europe's record-breaking heatwave: On May 25–26, 2026, the United Kingdom shattered its all-time May temperature record on consecutive days. Kew Gardens recorded 34.8°C on May 25; Northolt, west London reached 35.1°C on May 26 — exceeding the previous UK May record by a full 2°C. A tropical night followed with lows not dropping below 21.3°C at Kenley airfield. 17 Simultaneously, France activated its national heat warning system (la vigilance canicule) for the first time in May since its introduction in 2004, as temperatures reached 37.1°C in the south-west. Seven heat-related deaths were reported in France; an estimated 250 excess heat-related deaths occurred in England and Wales across the May 24–26 window. 17 Peter Thorne, a climate scientist at Maynooth University, described the records as "mind-bogglingly crazy." 17
El Niño development: NOAA's Climate Prediction Center (CPC) May 14 diagnostic discussion set the El Niño Watch probability at 82% for May–July 2026 onset, rising to 96% probability of El Niño continuing through December 2026–February 2027. 18 The model ensemble weighted median projects a Niño-3.4 warming of +2.73°C; the probability of a "very strong" event peaks at 37% for the November–January window. Some model runs suggest possible exceedance of 3°C, which would surpass the highest known peak of 2.7°C recorded in 1877. 19
WMO decadal outlook: On May 28, the World Meteorological Organization (WMO) released its Global Annual-to-Decadal Update (2026–2035), synthesizing projections from 13 institutes. Key findings: 86% chance that at least one year between 2026 and 2030 surpasses 2024 as the warmest year on record; 91% chance that at least one year temporarily exceeds 1.5°C above pre-industrial as an annual mean; 75% chance the 2026–2030 five-year mean exceeds 1.5°C. 20 Annual temperatures over 2026–2030 are projected to range between 1.3°C and 1.9°C above pre-industrial. Leon Hermanson, lead author from the UK Met Office, said: "There is an El Niño predicted for the end of 2026, which increases the chances of the following year, 2027, being the next record-breaking year." 20
US drought and fire: The contiguous United States recorded its worst April drought in recorded history, with a Palmer Drought Severity Index (PDSI) of -7.56 — worse than any prior April, and exceeded only by March 2026 (-7.85) and the Dust Bowl months of July–August 1934. 7 At least six billion-dollar weather and climate disasters have been logged in the United States so far in 2026. 7 Global burned area for January–April 2026 reached more than 150 million hectares — the highest in at least 15 years and approximately 22% above the previous record set in 2020. 7

IPCC pathway context

The Paris Agreement's 1.5°C threshold refers to a sustained multi-decadal average, not single-month exceedances. April 2026's +1.43°C (Copernicus) does not constitute a breach of that threshold on its own. The 12-month running mean through April 2026 stands at approximately +1.42°C above pre-industrial — the closest the continuous record has come to sustained exceedance, with 21 of the 22 preceding months individually exceeding 1.5°C.
At 431.12 ppm and rising at approximately 1.48–2+ ppm/year, CO₂ is the structural driver of that temperature trajectory. The IPCC Sixth Assessment Report (AR6) estimated the remaining carbon budget from early 2020 at approximately 500 GtCO₂ to limit warming to 1.5°C with 50% probability. 21 Global annual emissions of roughly 37–40 GtCO₂ have continued through 2024–2025; at that pace, the 1.5°C budget would be consumed within approximately a decade from now.
The developing El Niño introduces near-term upside risk to every indicator in this report. The WMO's 91% probability of at least one year individually exceeding 1.5°C in 2026–2030 is not a Paris threshold exceedance in the treaty sense, but it matters for risk models: individual annual exceedances tend to pull the multi-year running mean toward the threshold, reducing the margin for error in the remaining carbon budget. The probability that 2026 as a full-year annual mean exceeds 1.5°C is currently estimated in the 20–30% range across modeling groups; the stronger El Niño becomes, the higher that probability climbs.

Dataset citations

All datasets below are suitable for citation in ESG disclosures, scientific publications, and regulatory climate risk filings.
IndicatorDatasetInstitutionVersion / identifierData release
Surface temperatureERA5 global surface air temperatureCopernicus C3S / ECMWFERA5, 1991–2020 reference; April 2026 bulletin2026-05-08
Surface temperatureNOAAGlobalTempNOAA NCEIVersion 6.1.0-202605072026-05-11
Surface temperatureGISTEMP Land-Ocean Temperature IndexNASA GISSv4, 1951–1980 baseline~2026-06-10 (May data expected)
Atmospheric CO₂Mauna Loa CO₂ monthly meanNOAA Global Monitoring Laboratoryco2_mm_mlo.txt, file dated 2026-05-052026-05-05
Arctic sea iceSea ice cover bulletinCopernicus C3S / ECMWFERA5, 1991–2020 reference2026-05-08 (April bulletin)
Arctic sea iceNOAA/NSIDC Sea Ice IndexNational Snow and Ice Data Center (NSIDC)Version 4, 1981–2010 reference periodOngoing daily; monthly summary discontinued Oct 2025
Global mean sea levelIntegrated Multi-Mission Ocean Altimeter DataNASA / JPL / international partnersSatellite altimetry composite; ref epoch 19932026-04 (latest available)
Cover image: AI-generated illustration.

このコンテンツについて、さらに観点や背景を補足しましょう。

  • ログインするとコメントできます。