April 2026 Climate Baseline

April 2026 Climate Baseline

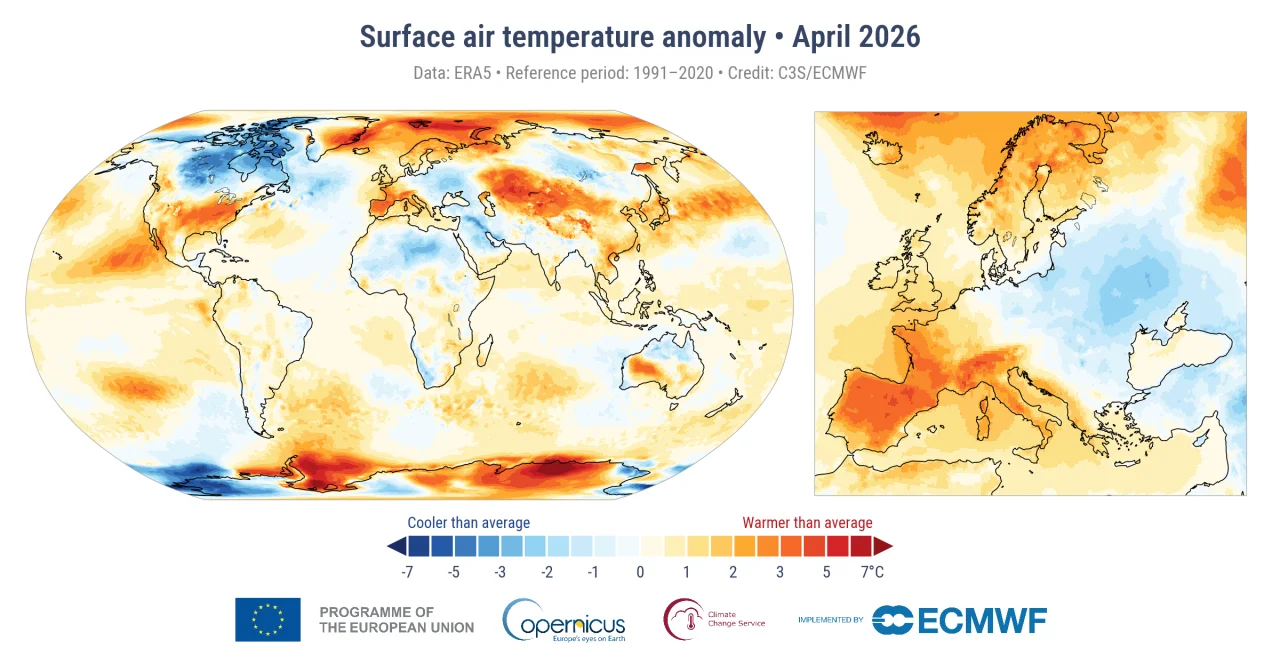
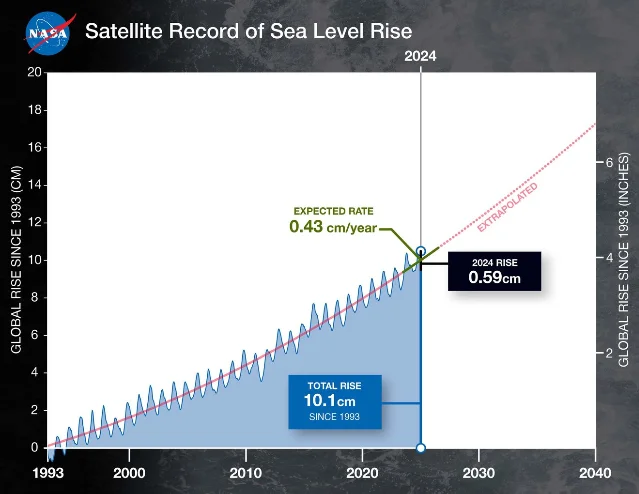
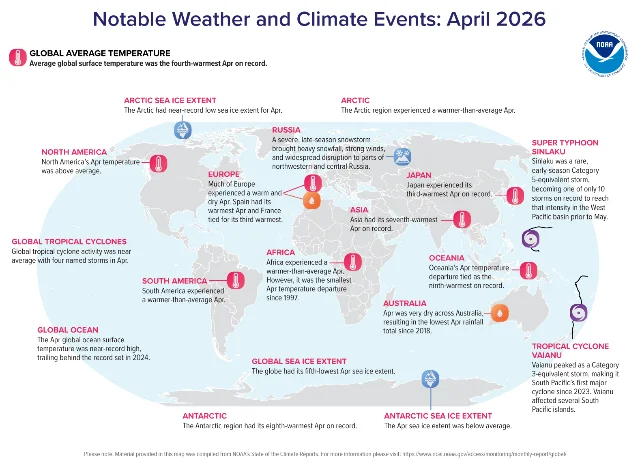
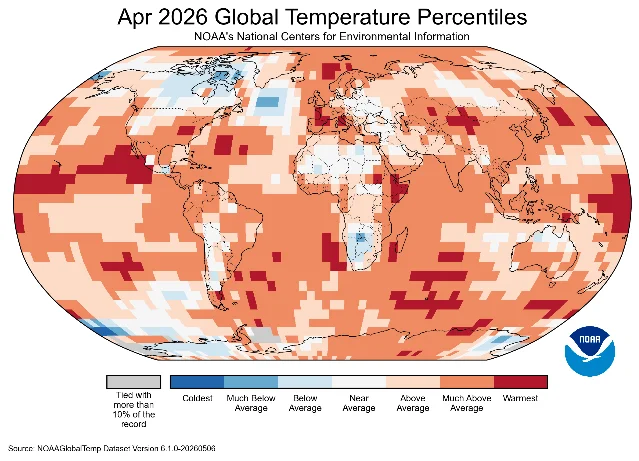
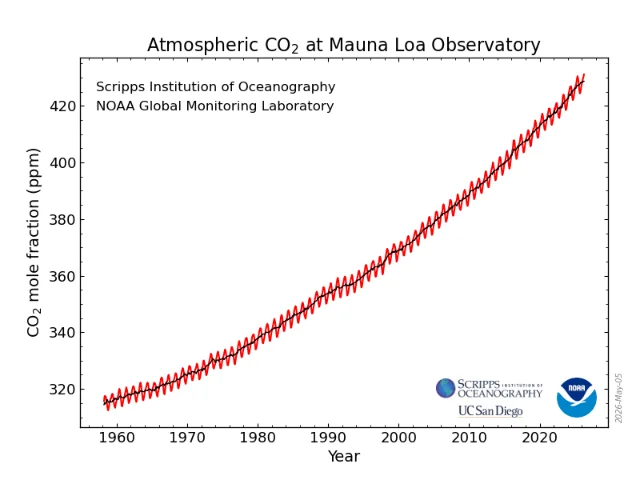
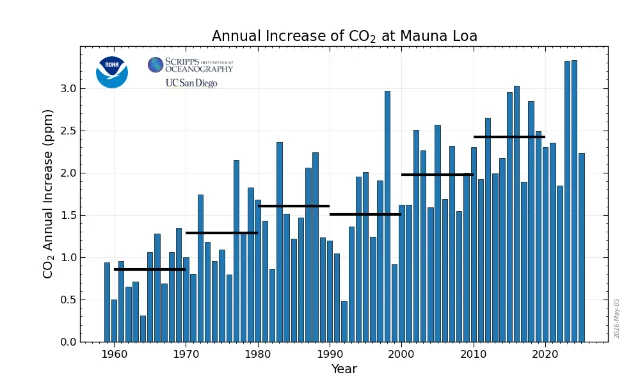
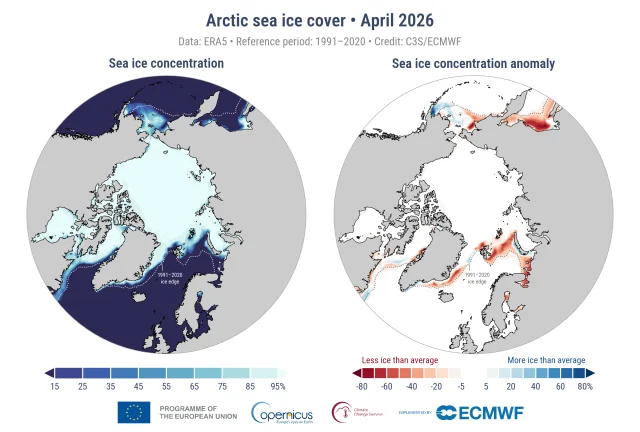
Monthly digest of April 2026's four core climate indicators: global temperature +1.43°C above pre-industrial (joint 3rd warmest April), CO₂ at record 431.12 ppm, Arctic sea ice second-lowest April on record, and cumulative sea-level rise reaching 95.8 mm above the 1993 baseline — with IPCC pathway context and ESG-ready dataset citations.

Climate & Ocean Data Update
2026/5/17 · 22:57
1 订阅 · 2 内容
April 2026 closed another month of measurements that, taken together, leave little ambiguity about the planet's trajectory. Three of the four core indicators tracked in this report set new April records or landed within a fraction of one. The fourth — global surface temperature — came in as the joint third-warmest April in the instrumental record, a result that would have been extraordinary just a decade ago but now barely registers as a surprise. Below is the full data digest, with dataset citations included for direct use in ESG and scientific reporting.
正在加载统计卡片…

Surface temperature

April 2026 global average surface air temperature reached 14.89°C, or +1.43°C above the pre-industrial baseline (1850–1900), making it the joint third-warmest April in the ERA5 dataset — tied with April 2016 and April 2020, separated by less than 0.01°C. 1 Only April 2024 (+1.51°C) and April 2025 rank warmer.
NOAA's independent analysis using NOAAGlobalTemp Dataset Version 6.1.0-20260507 placed April 2026 at +1.12°C above the 20th-century average, ranking it fourth-warmest April in the 1850–2026 record. 2 NASA GISTEMP v4 (Land-Ocean Temperature Index) reported +1.18°C against the 1951–1980 baseline, which converts to approximately +1.48°C pre-industrial equivalent, consistent with the Copernicus reading. 3
The three datasets differ in reference periods (pre-industrial 1850–1900, 20th-century average, and 1951–1980), which explains the numerical spread. When all three are expressed against the 1850–1900 baseline, they converge near +1.43–1.48°C. For professional ESG reporting that references IPCC's Paris Agreement thresholds, this distinction matters: the 1.5°C and 2°C guardrails are defined against a pre-industrial reference, not a 20th-century one.
The 12-month running mean (May 2025–April 2026) stands at +1.42°C above pre-industrial, putting it just below the 1.5°C threshold as a continuous average — though 21 of the 22 individual months in that window exceeded 1.5°C when measured individually. 1
April 2026 also marked 50 consecutive Aprils above the 20th-century average — the last below-average April was in 1976. 2 Record-warm temperatures covered 7.4% of Earth's surface, the second-highest April percentage in the record since 1951. Global sea surface temperature (60°S–60°N) averaged 21.00°C, just 0.04°C below the all-time April SST record set in 2024. 1
Outlook through 2026: A strong El Niño is now developing in the equatorial Pacific. NOAA places a 61% probability on El Niño conditions emerging between May and July 2026, with a 27% chance of a strong event during the peak hurricane season (August–October). 2 Carbon Brief's synthesis of 637 model runs from 13 modelling groups projects the 2026 global average at 1.47°C above pre-industrial (range: 1.37–1.58°C), a 62% probability of ranking as the second-warmest year on record and a ~30% chance of exceeding 1.5°C as an annual mean for only the second time in the instrumental record. 4 The largest temperature amplification from the El Niño peak — expected November 2026–January 2027 — will likely manifest in 2027, given the approximate three-month lag between ENSO peak and global surface temperature response.

Atmospheric CO₂

Mauna Loa Observatory's April 2026 monthly mean reached 431.12 ppm, a new record high for any April in the continuous measurement record that began in March 1958. 5 6 The data were released May 5, 2026 (dataset file creation: 03:55 UTC) and carry preliminary status, pending reference gas recalibration.
Month-over-month, CO₂ rose +0.97 ppm from March 2026's 430.15 ppm. Year-over-year, the increase is +1.48 ppm above April 2025's 429.64 ppm. 6 The de-seasonalized trend value for April 2026 is 428.70 ppm, which strips the annual vegetation cycle and shows the underlying accumulation rate.
Against pre-industrial levels of approximately 280 ppm, the April 2026 reading is roughly 54% higher. 7 Ice cores show atmospheric CO₂ did not exceed 300 ppm during any of the past 800,000 years — the current 431 ppm is geologically comparable to the Mid-Pliocene Warm Period roughly 3 million years ago, when global temperatures were 2.5–4°C higher and sea levels significantly elevated. When continuous measurements began at Mauna Loa, the April reading was below 320 ppm; the total increase since then exceeds 111 ppm in under 70 years.
The rate of increase has been accelerating for decades. The decadal average annual growth rate has risen from roughly 0.8 ppm/yr in the 1960s to approximately 2.6 ppm/yr for the 2015–2024 period — more than a three-fold increase. 8 The 2024 annual growth rate of 3.33 ppm/yr was near-record (tied with 2023), partly driven by reduced terrestrial carbon uptake during the 2023–2024 El Niño. The 2025 growth rate moderated to 2.23 ppm/yr. 8
April sits at or near the seasonal CO₂ peak: Northern Hemisphere plant decay releases CO₂ through winter, with concentrations typically topping out in May before the growing season absorbs carbon through summer. Early May 2026 readings are already tracking above April's monthly mean — May 16 logged at 432.49 ppm — suggesting the May 2026 monthly mean will exceed April's record. 9

Arctic sea ice

April 2026 Arctic sea ice extent averaged 13.6 million km²0.7 million km² (4.8%) below the 1991–2020 April average, ranking as the second-lowest April extent in the 48-year satellite record (1979–present), behind only April 2019 (which ran 5.7% below average). 10 The below-average anomaly was most pronounced in the Sea of Okhotsk, northern Barents Sea, and the Svalbard region.
The context for April's ranking stretches back to winter. The 2026 winter maximum, reached on March 13, measured only 13.76 million km² — the lowest winter maximum in the satellite record, breaking the 2025 record by approximately 0.03 million km². 11 Since November 2025, Arctic sea ice has ranked among the three lowest for every single month. This is not a one-month anomaly; it is a persistent multi-month deficit across the entire freezing season.
By April 24, the daily Arctic extent had fallen to approximately 13.30 million km², compared with 15.35 million km² on the same date in 1980 — a loss of 2.05 million km². 12 Arctic-wide modeled sea ice volume reached a record low for late April (Danish Meteorological Institute analysis), with thick multi-year ice now restricted to a comparatively thin band from northwest Greenland to the eastern Beaufort Sea. Since May 6, daily Arctic extent has been the lowest on record for each respective date. 2
For long-term context: September minimum extent — the annual low point — has been declining at roughly 13% per decade since 1979, and since 2007 has ranged between 3.5 and 5.0 million km². The combination of record-low winter maxima and record-low spring ice volume sets up conditions for a potentially severe 2026 summer melt season. 13
One operational note: NSIDC's monthly Sea Ice Today analysis and sea ice volume comparison tools have been suspended following a funding termination. Monthly sub-indicator detail from NSIDC is currently unavailable; the April 2026 figures above are drawn from Copernicus C3S (using a 1991–2020 reference baseline), which differs slightly from NSIDC's standard 1981–2010 reference. 14

Global mean sea level

NASA's Earth Indicator records cumulative global mean sea level (GMSL) rise of 95.8 ± 4.0 mm since the 1993 satellite altimetry reference epoch as of April 2026. 15 The NASA Sea Level Change Portal homepage separately reports a cumulative figure of 94.3 mm, with the difference reflecting dataset version and smoothing methodology. 16
The more important figure for climate risk applications is the current rate of rise. Hamlington et al. (2024), published in Nature Communications Earth & Environment, documented that the altimetry-derived rate has more than doubled over the satellite record — from approximately 2.1 mm/yr in 1993 to approximately 4.5 mm/yr in 2023 — with a statistically significant acceleration of 0.08 ± 0.06 mm/yr². 17 Total rise 1993–2024 in that dataset is 111 mm. The full-record mean of approximately 3.3 mm/yr is, as the authors note, increasingly unrepresentative of what coastal infrastructure is actually experiencing now.
The 2024 annual anomaly was striking: sea level rose 5.9 mm in a single year, well above the expected ~4.3 mm. 18 The mechanism was unusual: roughly two-thirds of 2024's rise came from thermal expansion (ocean warming), rather than from ice sheet and glacier mass loss, which typically dominates. This reversal reflects how record ocean heat in 2024 directly translated into measurable sea level through water density changes.
A 2026 study by Cazenave et al., published via Earth's Future, estimated that deep ocean warming (below 2,000 m) now contributes approximately 0.4 mm/yr to GMSL — roughly 10% of the observed rate. 19 This contribution was previously not fully accounted for in sea level budgets because Argo floats only profile the upper 2,000 m of the ocean. If the current acceleration trajectory persists, Hamlington et al. project rates reaching 5.0 mm/yr by 2030, 5.8 mm/yr by 2040, and 6.5 mm/yr by 2050. 17

Extreme events, April 2026

April's elevated baseline temperatures translated directly into several documented extreme events.
South Asia heatwave: A severe pre-monsoon heatwave struck northwestern India and Pakistan in mid-to-late April 2026, with multiple cities recording daily maximum temperatures above 46°C. At least 37 heat-related deaths were reported in India and 10 in Karachi, Pakistan — early counts that typically underestimate actual mortality. 20 A World Weather Attribution (WWA) study published May 14, 2026 found that human-caused climate change made the 15-day extreme heat event approximately 3 times more likely and roughly 1°C hotter than it would have been in a pre-industrial climate. In the current climate, such an event has an approximately 1-in-5 annual probability in April. The WWA study also noted that extreme dry heat is now arriving earlier in the pre-monsoon period — lengthening the dangerous heat season — and that neither India nor Pakistan classifies heatwaves as notifiable disasters, limiting access to relief funding. 20
Tropical activity: Super Typhoon Sinlaku formed in the West Pacific and reached Category 5-equivalent intensity — one of only ten storms on record to achieve that threshold in the West Pacific prior to May. Early-season Category 5 storms in that basin are historically rare. 2
U.S. drought: The contiguous United States experienced its worst April drought conditions in recorded history, with a Palmer Drought Severity Index (PDSI) of -7.56 — exceeded in the historical record only by the Dust Bowl months of July and August 1934 and by March 2026 (-7.85). 2
Wildfires: Global burned area for January–April 2026 was the highest in 15 years, exceeding 150 million hectares and running approximately 22% above the previous database high set in 2020. 21

IPCC pathway context

The Paris Agreement's 1.5°C threshold is defined as an increase in global average temperature relative to pre-industrial levels sustained over multiple decades, not a single-month exceedance. By that standard, April 2026's individual reading of +1.43°C (Copernicus) does not constitute a breach — but the 12-month running average of +1.42°C represents the closest the record has come to sustained exceedance.
Atmospheric CO₂ is the primary driver, and the physics of the carbon budget make the arithmetic stark. At 431.12 ppm, CO₂ is 54% above pre-industrial levels and climbing at 1.48–3.33 ppm/yr depending on the year. The IPCC Sixth Assessment Report (AR6) estimated that, to limit warming to 1.5°C with 50% probability, the remaining carbon budget from early 2020 was approximately 500 GtCO₂. 22 Annual global emissions of approximately 37–40 GtCO₂ have continued through 2024–2025; at that rate, the 1.5°C budget would be consumed within approximately a decade, independent of any natural variability.
The developing El Niño introduces additional near-term risk. Carbon Brief's full-year 2026 projection of 1.47°C carries a ~30% probability of exceeding the 1.5°C annual mean threshold for only the second time in the record. 4 With El Niño's peak warming impact expected to land in 2027, the probability of annual exceedance in that year rises substantially across ensemble projections.

Dataset citations

The following datasets underpin this report. All are suitable for citation in ESG disclosures and scientific publications.
IndicatorDatasetInstitutionVersion / identifierRelease date
Surface temperatureERA5 global surface air temperature bulletinCopernicus C3S / ECMWFERA5, 1991–2020 reference; bulletin published2026-05-08
Surface temperatureNOAAGlobalTempNOAA NCEIVersion 6.1.0-202605072026-05-07
Surface temperatureGISTEMP Land-Ocean Temperature Index (LOTI)NASA GISSv4, 1951–1980 baselineData retrieved 2026-05-17
Atmospheric CO₂Mauna Loa CO₂ monthly meanNOAA Global Monitoring Laboratoryco2_mm_mlo.txt, file dated 2026-05-052026-05-05
Arctic sea iceSea ice cover for April 2026Copernicus C3S / ECMWFERA5, 1991–2020 reference2026-05
Global mean sea levelNASA Sea Level Earth IndicatorNASA JPL / PODAACSatellite altimetry composite2026-04 (latest update)

围绕这条内容继续补充观点或上下文。

  • 登录后可发表评论。